Cycling guide
How to compare cycling seasons without spreadsheets
Use year-over-year cycling comparisons to understand mileage, surface mix, and maintenance load without manual spreadsheets.
Updated: 2026-05-08
Comparing cycling seasons is not only about total distance. A useful comparison explains when volume changed, which surfaces changed, and what that means for maintenance planning.
Key takeaways
- Compare the shape of the season, not only the final yearly distance.
- Surface mix changes can explain why maintenance needs changed from one year to another.
- Use a few reliable metrics so the comparison remains actionable.
Why yearly totals are not enough
Two years can end with similar total distance but very different riding patterns. One season may be front-loaded before summer; another may grow steadily. One may include more indoor rides, while another adds off-road volume.
Those differences affect fatigue, component wear, and maintenance timing. A good comparison should show the shape of the season, not just the final number.
Use cumulative comparisons
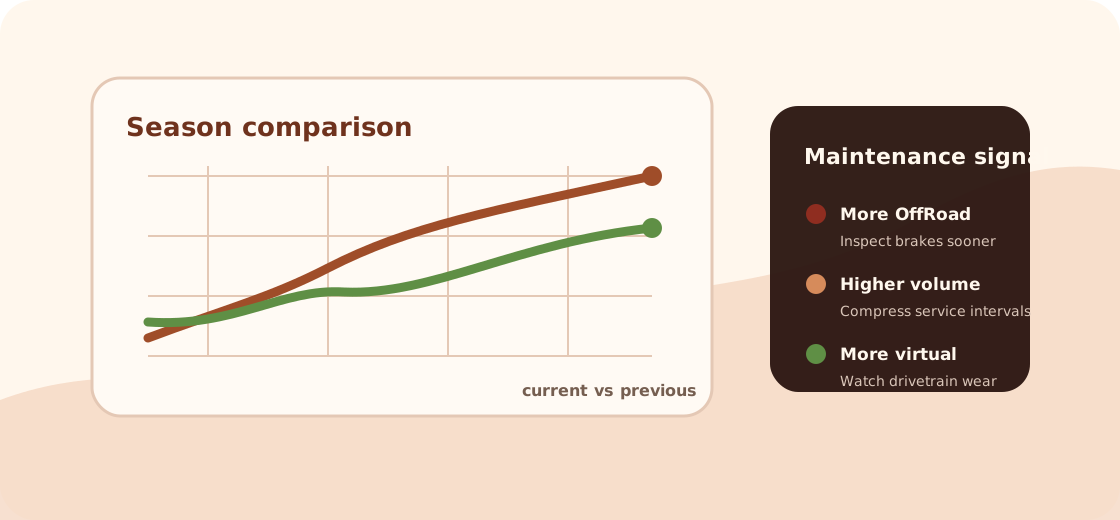
Cumulative views make it easier to see whether the current year is ahead or behind a previous year at the same point in time. This helps riders understand trends while the season is still happening.
Half-month or monthly grouping is usually enough. It smooths daily noise while preserving the important changes in training and usage.
Connect comparisons to maintenance
If this year has more off-road distance than last year, drivetrain cleaning, bearings, brakes, and suspension checks may need earlier attention. If most growth is virtual, drivetrain wear may still increase while tire wear does not.
Season comparison becomes more useful when it feeds maintenance decisions instead of remaining a dashboard curiosity.
Keep the analysis simple
Focus on a few metrics: total distance, real distance, virtual distance, Road, OffRoad, and activity count. Too many metrics can make the comparison hard to act on.
The goal is to answer simple questions: Am I riding more? Is the surface mix different? Should I inspect the bike earlier than last year?
Season metrics that can inform maintenance
| Metric | What it tells you | Maintenance signal |
|---|---|---|
| Total distance | Overall bike usage trend | Higher volume may compress service intervals. |
| Real distance | Outdoor load compared with indoor training | More outdoor load can increase tire, brake, and bearing checks. |
| OffRoad distance | Exposure to dust, mud, vibration, and braking load | Inspect drivetrain, brakes, suspension, and bearings earlier. |
| Activity count | How often the bike is used | Frequent short rides can still require regular cleaning and checks. |
Compare seasons without building a spreadsheet
Ride Data Hub turns Strava activity history into year-over-year charts for distance, surface mix, and activity volume.
Frequently asked questions
Why compare cumulative seasons?
Cumulative comparisons show whether you are ahead or behind a previous year at the same point, which is more useful than waiting for December totals.
Which metrics should I compare first?
Start with total, real, virtual, road, off-road, and activity count. Add more only if they change a decision.
How does season comparison help maintenance?
If this season has more volume or more off-road riding, some service checks may need to happen earlier than last year.